

Introduction
- Calendar aging of NCA lithium batteries is investigated by storing commercial 18650 cells with NCA cathode and graphite anode at different states of charge and temperatures. Calendar aging comprises all aging processes that lead to a degradation of a battery cell independent of charge-discharge cycling. It is an important factor in many applications of lithium-ion batteries where the operation periods are substantially shorter than the idle intervals, such as in electric vehicles.

- The capacity fade and impedance rise of a commercial 18650 Li-ion battery induced by calendar aging the capacity of the cells studied was found to decrease in a linear fashion with storage time. The rate of capacity decay is higher at higher temperatures during storage. It was found that the battery internal resistance based on current pulse measurements increased with storage time. Interestingly, the internal resistance calculated from the voltage drop after 1 s of the current pulse and the internal resistance calculated from the voltage drop after 20 s of the current pulse have the same ratio of about 76% for all aging stages and all aging conditions (that is, the ratio of the internal resistance obtained by the 1s pulse test and the internal resistance obtained by the 20s pulse test is 76%). This means that aging affects fast processes (ohmic resistance, polarization resistance) and slower processes (diffusion) in a similar way.
Define Calendar Life
Battery life includes battery cycle life and storage life. The cycle life refers to the time required for the battery to reach the end of its life in the working condition cycle or conventional cycle process
- The Calendar Life is Defined as Follows: It refers to the time required for the battery to reach the end of its life in an open-circuit state at a certain reference temperature, that is Battery life in standby. There are also studies on lithium battery life testing under constant voltage conditions. Calendar Life evaluates the effect of the passage of time on battery performance under conditions that minimize battery usage.
- For Energy-Type Power Batteries: the performance evaluation is mainly based on energy characteristics or capacity characteristics, and the research on auxiliary power characteristics. It is generally defined that the battery life ends when the capacity retention rate reaches 80%. According to the calculation method of Freedom CAR, the power and the surface impedance ASI are inversely proportional, so the impedance of the battery is measured periodically.
Buy Now: SEMCO 10 Channel Automatic Cell Sorting Machine With Bar Code Scanner.
1. Overview
Parameter Measurement
In calendar aging, capacity decay and power decay depend on time, charge-discharge amount and operating parameters: temperature, state of charge (SOC), current amplitude and depth of discharge (DOD). Differentiate Lithium. The calendar and cycle aging of ion batteries is a process of decoupling the factors affecting the cycle and the factors of shelving, that is, whether the aging mechanism is only related to the cycle process or only the shelving process, which is another direction of life research.
Discussion on the mechanism of calendar aging by known experiments:
a) Calendar decay theory of capacity
Many researchers believe that the loss of active lithium is the capacity fading mechanism that dominates low temperatures. This is based on the assumption that the degradation of the cathode and anode is much slower than the consumption of available active lithium. Therefore, the amount of active lithium is the limiting factor for the battery capacity. It is theorized that active lithium is mainly lost through electrolytic reduction at the anode surface, resulting in the formation of an insulating solid electrolyte interface (SEI) near the anode surface.
There are several different opinions on the model describing the aging of the calendar. The rate of capacity decay during calendar aging, as a function of time, described as the square root of time. It has also been assumed that capacity decreases linearly over time during the initial period and proportional to the square root of time in the later period
b) Calendar increase of resistance
In addition to capacity fading, there are also literatures discussing the changes in battery impedance during calendar aging of Li-ion batteries. In most cases, the increase in internal resistance is considered to be the effect of the growing interfacial film on the two electrodes.
c) Electrochemical impedance spectroscopy
EIS remains one of the most successful techniques for gaining insight into individual processes and process changes in electrochemical cells in a non-destructive manner. EIS impedance spectroscopy is often used to analyze the correlation of battery characteristic parameters with battery charge SOC and temperature. Of course, it can also be used for the study of battery calendar aging. Some literatures quantify aging by fitting EIS data models with equivalent circuits.
Data content that will be covered in this article:
The decay theory holds that, for example, the loss of electrode active material and the loss of active lithium will affect the open circuit voltage (OCV) of lithium-ion batteries. However, the effect of storage time on OCV has not been investigated. In the study presented here, a commercial 18650 lithium-ion battery was used to investigate the changes in battery capacity and battery impedance during calendar aging. The description of battery impedance changes is based on both pulsed test measurements and in-depth electrochemical impedance spectroscopy analysis. The researchers developed an in-house code to deconvolve EIS spectra with an equivalent circuit model. The cell’s calendar aging was then investigated by quantifying changes in different parameters of the model and correlating them to the degradation mechanisms that lead to changes in electrochemical behavior. In addition, the change in internal resistance due to the pulse test and the total resistance value from the EIS analysis were compared.
In addition, for the reference cell, parameter analysis and EIS test are also carried out. The test results reflect that the conventional electrochemical parameters of the electrode are the main factors affecting the calendar life, which affects the cell’s calendar capacity decay, internal resistance increase and EIS impedance spectrum. The change. The aging caused by the additional charging and discharging process caused by the parameter measurement will be considered separately.
Buy Now: SEMCO Automatic Sticker Machine for Batteries SI PI 32700.
2. Trials
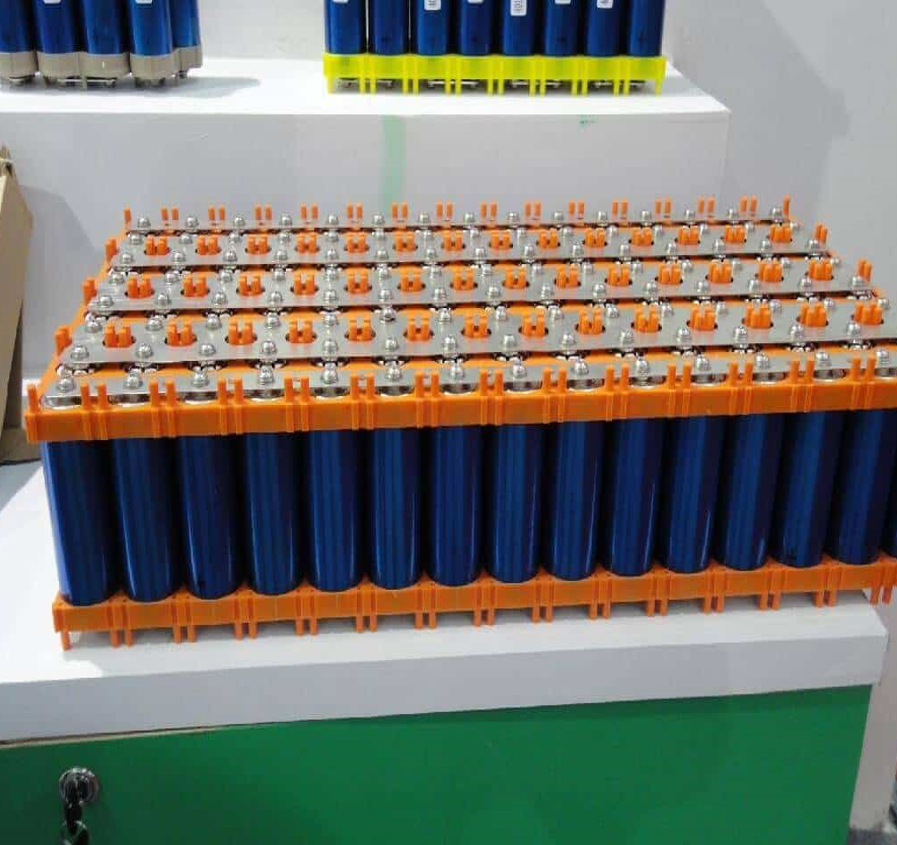
Test conditions sample, testing the commercial 18650 type high-energy cylindrical battery US18650V3 manufactured by Sony Energy Devices Corporation. Their cathode active material is lithium nickel cobalt manganate (NMC) and the anode active material is graphite. The rated capacity according to the manufacturer is 2.15Ah measured at a discharge current rate of 0.2C. The capacity value is the reference value of the discharge rate of the new cell equipment.
Testing Process
- During the calendar aging test, the cells are stored under controlled conditions in a climate chamber. After a storage period of about 30 days, the cells were placed in a 20°C environment until they reached their thermodynamic equilibrium. Then, electrochemical characteristic parameter measurement is performed, after which the SOC is reset.
- At room temperature, the battery was charged with constant current to 4.2V at 1C, then charged with constant voltage until the current decreased to 0.05C (considered a CCCV process), and then discharged with constant current at 1C to 2.5V (CC).
- Next, two 1C CC discharge + CCCV charging processes are performed. The discharge amount obtained in the second discharge process is considered to be the actual capacity of the cell.
- The cell impedance was then tested by applying a 2C discharge pulse of 20μs duration and a 1C charge pulse of 40μs duration. Pulses are applied at every 10% SOC between 100% and 0% SOC. The SOC level was set to adjust the SOC by discharging 10% of the SOC at 1C, with a 30-minute pause in place.
- The cells are then charged at a current rate of 1C according to CCCV and then set to 50% SOC by a CC discharge of 0.5C. Subsequently, EIS measurements were performed in constant current mode with a frequency range of 2 kHz to 10 MHz, and 8 points were measured in each frequency range. Measurements were made at open circuit voltage (no DC applied), the ideal voltage response was set to 10mV, and the maximum AC amplitude was set to 0.2A.
Stored Procedure
The combinations of temperature and SOC tested during storage are shown in Table 1. To see statistical effects, each test was performed with three cells. After each test, the cells are set to the specified SOC level. After disconnecting the battery from the battery test system, store it at the specified ambient temperature T for about 30 days. The results shown in this work are based on approximately 470 days of observed aging (approximately 360 days for EIS analysis).

Reference Cell
In order to study the effect of the above different parameters on the battery degradation process, four cells were used as a reference. Through the same procedure as the other cells, they were initially measured and set to 25%, 50%, 75% and 100% storage SOC. After that, they were kept open circuit at 20 °C and checked every 30 days to monitor self-discharge. If the open circuit voltage is found to be lower than the initial setting of SOC, the battery is charged by CCCV to the initial open circuit voltage to compensate for self-discharge. The amount of charge transferred during these processes was found to be very small compared to the battery capacity. Therefore, the self-discharge of the reference cell is negligible during the test interval. Apart from these controls, the reference cell is simply stored without any further measurements.
Under the premise of paying attention to the calendar life, the middle part mainly involves the discussion of the following aspects:
- The relationship between capacity decay and storage time;
- The relationship between capacity decay and storage temperature;
- The relationship between capacity fading and stored state of charge (SOC);
- The changing trend of DC impedance during aging;
- The change trend of the AC impedance spectrum during the aging process.
In terms of space, the data fitting of the AC impedance spectrum of the test results, the influence of the charging and discharging process involved in the periodic parameter measurement on the battery aging through the reference cell, and the introduction of the prediction ability formed based on the test results will all be discussed. Continue in “Next”. Regarding related concepts such as calendar life, and the related program settings of the test, please refer to yesterday’s article “A lithium battery is the same as a new battery if it is not used? An Experimental Study on Calendar Aging of NCM Lithium Batteries (Part 1) Look.

Buy Now: SEMCO Cell Grading Machine – SI ES 5V 6A 512CH – Energy Saving.
3. Results & Discussion
3.1 Battery Capacity
3.1.1) Time Dependence
The actual capacity and initial capacity of the battery are both measured under the condition of 0.1C discharge current. The proportional relationship between the actual capacity and the initial capacity changes with time, as shown in Figure 1.
Each data point corresponds to the arithmetic mean of the actual relative capacities of the three batteries tested under the same conditions, and the capacity measurements for the three samples are always very similar. The average initial battery capacity was 2.164Ah with a standard deviation of 0.006Ah, indicating a high consistency between samples.
The battery capacity of all cells tested decreases with storage time. This capacity fading can be attributed to the loss of active lithium. In order to understand the three-time model equations (square root, linear and generalized power functions) describing the capacity decay, the experimental parameters were fitted according to the three equations respectively. As discussed in Section 1, many authors describe the capacity fading during calendar aging as the square root of a time function, based on the assumption that the growth of SEI slows further depletion of active lithium. This behavior is simulated by equation (1). where a1 and a2 are the offset and square root aging parameters, respectively, and t is the storage time in days:
The capacitance decays linearly with time, as observed in previous work, with b 1 and b 2 as offset and linear aging parameters, respectively, given by equation (2):
The third test model function is a generalized power-law function with offset c1, power aging parameter c2 and exponent c3:
For the offset parameters a 1, b 1 and c 1, values close to 1 are expected since all three model functions refer to relative capacity.

Figure 1. Relative battery capacity versus storage time at various storage temperatures and storage SOCs plotted during a calendar burn-in test. In addition, there is no test process in the middle of the relative battery capacity of the reference cell, which is stored at 20°C for 186 days.
The square root and linear function of the time function were fitted by the linear regression method to the experimental data as shown in Figure 1. For power-law function fitting, the nonlinear algorithm Levenberg-Marquardt is mainly used.
Table 2 lists the estimated parameters for the three model functions.
Table 2, the fitting parameter values of the model function, describe the capacity reduction due to calendar aging, and the table is all dimensionless parameters.
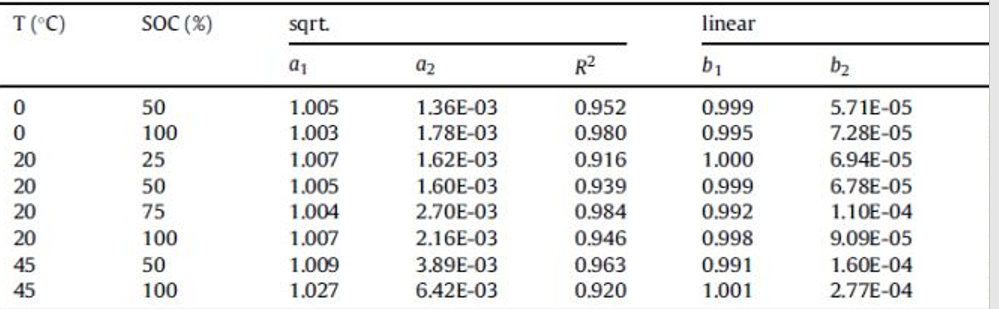
For most datasets, the linear model function has a higher correlation coefficient R 2 than the square root function, which means that the linear model function is more accurate. Fitting the dataset with a power-law function shows that its correlation coefficient is larger and the fitting accuracy is higher. This is because the power law function has one more power exponent parameter c3 than the linear function. The main variation range shown by c3 is between 0.72 and 0.96, which is obviously closer to 1 (linear function) than 0.5 (square root function), but it is Does not show any trend of change.
An explanation for this behavior could be that, in addition to the continuous increase in SEI, other degradation mechanisms that did not slow down during long-term storage could be responsible for the linear part of the reduction in capacity. Such “between” functions (where the exponent of the function varies within a certain range) is also found in the literature. The observed capacity fading may also be a superposition of the compound square root law of capacity loss due to the growth of the SEI under open-circuit conditions, with the additional linear capacity fading due to charge-discharge with intermediate parametric measurements, which will be discussed in Section 3.3. discussed in more detail in.
Buy Now: SEMCO Cell Grading Machine – SI ES 5V 3A 512CH – Energy Saving.
3.1.2) Temperature Dependence
The temperature dependence of the capacity fading shows a clear trend. At 50% storage SOC, the capacity decay rate b 2 is slightly higher at 20°C and slightly above 0°C (see Table 2). The capacity decay rate at 45°C for capacity reduction is twice that at 20°C. The decay trend observed at 100% SOC is similar to the trend at 45°C.
One way to model the temperature dependence of capacity decay during calendar aging is the Arrhenius equation.
where k is the reaction rate, A is the pre-exponential factor, E is the activation energy, R is the gas constant, and T is the absolute temperature. Table 3 shows the parameters of the Arrhenius equation for the capacity decay rate b2 for two different storage SOCs at different temperatures. The correlation coefficient R2 is higher than 0.9, indicating that the temperature dependence of the capacity decay rate can be appropriately described by the Arrhenius equation. The resulting activation energy values are of the same order of magnitude as those found in other studies.
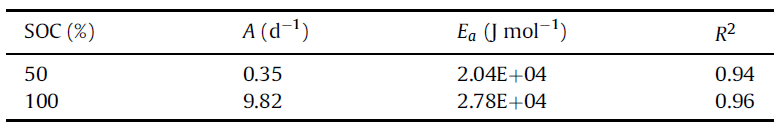
A physical explanation for this temperature behavior is that with increasing temperature, the conductivity of the SEI film rises, which leads to higher current flow through the layer and also to a higher rate of electrolyte decomposition at the SEI/electrolyte interface.
Buy Now: SEMCO Cell Grading Machine – SI CT 5V 3A 512 – Channel Linear.
3.1.3) SOC Dependencies
The capacity decay rate of 100% SOC cells is significantly higher than that of 50% SOC cells at any temperature, which has been shown in Figure 1. Many studies have found that high storage SOC accelerates capacity decay. It has been shown that low graphite anode potential at high SOC contributes to electrolyte reduction and SEI growth, and thus leads to accelerated loss of active lithium during calendar aging. This trend is not followed at 25% SOC and 75% SOC at 20°C. The capacity of 25% SOC cells decreases faster than that of 50% SOC cells. Cells stored at 75% SOC are the fastest capacity decay among all SOC-level storage cells. This phenomenon may be related to the experimental procedure of resetting the SOC after the test is completed, which will be discussed in Section 3.3.
3.2 Battery Impedance
Cell impedance was investigated by current pulse measurements and EIS. The current pulse can determine the overall resistance of the cell at a certain SOC, temperature and current level. EIS is performed only at open circuit voltage (OCV), but provides a more detailed description of changes in electrochemical phenomena inside the battery than pulsed tests.
Buy Now: SEMCO Cell Grading Machine – SI CT 5V 6A 512 – Linear.
3.2.1) Pulse Test
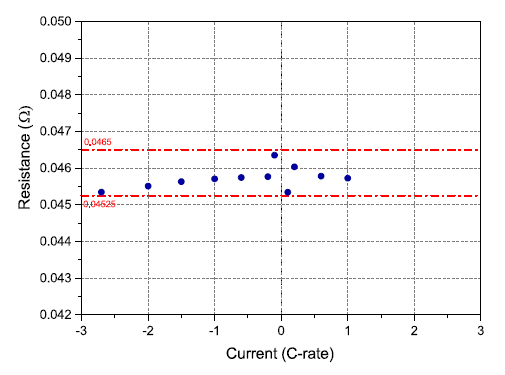
The internal resistance R of a cell (at a battery specific SOC), can be derived from the voltage and current, R = (Uocv-Ut)/I, where Uocv is the open circuit voltage before the pulse and Ut is the current load after a certain time terminal voltage. Assuming that the current pulse does not significantly change. the SOC state, the open circuit voltage does not change during the duration of the pulse. For simplicity, only the internal resistance measured at 50% SOC is discussed here, other SOC points tend to be similar.

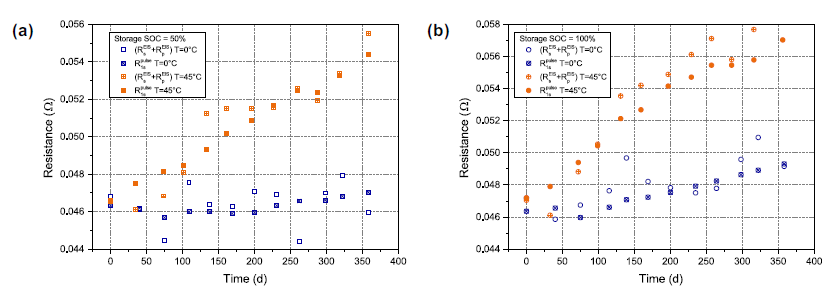
Figure 2: (a) Shows the internal resistance R 1s as a function of storage time measured by means of the voltage response after a 1 s current pulse. This quantity shows the overall resistance of the cell but it does not include the effect of the impedance effect of the diffusion process.
Figure 2: Internal resistance measured at 50% SOC by current pulse test versus storage time. Storage conditions are indicated in the legend. Except for the results from the calendar aging test, the internal resistance of the reference cell stored at 20°C for 186 days, with no other test process in between:
(a) Internal resistance calculated from the voltage drop after 2C current pulse discharge for 1 s.
(b) Internal resistance calculated from the voltage drop after 20 s of 2C current pulse discharge.
The change in internal resistance in Fig. 2(a) can be approximately described as a linear function of time. The increase in internal resistance during calendar aging is usually due to an increase in ionic resistance due to the formation of separators (such as SEI) in the surface layer. The resistance rises rate of cells stored at 45°C is significantly higher than that of cells stored at lower temperature. In addition, a trend of faster increase in resistance of batteries stored at higher SOC can be observed from Fig. 2(a). In particular, cells stored at 100% SOC increased at a faster rate than cells stored at 50% SOC at the same temperature.
In particular, for 50% SOC cells stored at 20°C and 50% SOC cells stored at 0°C, the internal resistance decreases at the initial stage, and the internal resistance begins to increase after about 200 days (see Figure 1). The actual capacity, however, has been decreasing since the beginning. It has been pointed out that cycling can lead to porous structures in the electrodes, which can reduce the charge-discharge resistance. It is speculated that the reason is that, under mild storage conditions, the decreasing trend of resistance caused by the porous structure caused by charging and discharging during parameter measurement is greater than the increasing trend of internal resistance caused by calendar aging in the initial stage, so the total resistance value First decreased, then increased. This trend is part of the general upward trend of internal resistance. (See Section 3.3).
Figure 2(b) shows the internal resistance measured in voltage response after 20 s of discharge at the current rate of 2C. This quantity is a measure of the overall cell resistance, including slow processes like solid-state diffusion. Durations of 20 s and 1 s were consciously chosen to study resistance with and without solid-state diffusion, respectively. The reason for this choice can be more clearly illustrated by the electrochemical impedance spectroscopy analysis presented there. next section (section 3.2). The relative storage time change of R20S is almost the same as the observed relative change of R 1s relative.
3.2.2) Electrochemical Impedance Spectroscopy
The EIS analysis presented in this work was carried out about 360 days from a new cell. The initial impedance spectra showed very little variation in different cells, indicating good cell quality. The initial and end EIS spectral measurements of the cells stored at 45 °C and 100% SOC are shown in Fig. 3(a). The frequency range chosen for the experiments covers all key phenomena inside the battery. At very high frequencies (>840 Hz), inductive effects caused by cell winding, geometry and cable are observed. At the impedance intercept from the real axis, the imaginary part of the impedance cancels. The resulting real part is mainly due to the ohmic resistance of the electrolyte. In the range from 840 Hz to 1 Hz, the SEI and charge transfer at the electrodes dominate the cell resistance, presenting a (depressed) semicircle shaped cell impedance in the Nyquist plot. This is caused by a combination of the properties of resistance and capacitance. The semicircular depression is due to the porous nature of the electrode. At low frequencies (< 1Hz) solid-state diffusion processes become important. As shown in Fig. 3(a), the impedance has a slope shape, as expected from the diffusion process. The impedance of the calendar-aged cells exhibits similar properties, despite a change in the Nyquist plot.
The equivalent circuit diagram to which the measured impedance spectrum data is fitted is shown in 3(b), the battery impedance of the shown equivalent circuit is given by the sum of the various elements:
This circuit uses elements of all the phenomena discussed earlier. Fitting spectra using an equivalent circuit model must keep in mind that complex models can lead to overfitting, as such a phenomenon can be clearly seen in some work.
They fit their spectra with 13 parameters. In our case, this is especially important in the frequency range of 840 Hz ~ 1 Hz, where there is only one concave semicircle (Fig. 3(a)) instead of the expected two semicircles representing charge transfer and surface layer electrodes. The reason is that independent effects are superimposed in the spectrum and cannot be separated using the equivalent circuit model approach. To investigate the combined effect of the polarization resistance and capacitance effects of the two electrodes, this depressed semicircle, is represented by a ZARC element. The ZARC element consists of a resistor and a constant phase element (CPE) in parallel. The resistance Rp of this ZARC element represents the total polarization resistance, which is the combined resistance due to charge transfer in the two electrodes and the SEI layer on the anode, while the constant phase element (Qp) represents the bilayer distributed over the porous electrode Capacitance and resistance characteristics.


The frequency dispersion is related to the CPE generalized polarized capacitance Qp, and its unit is . This suppression factor α is a measure of the time constant distribution due to the porous structure of the electrode. It is related to the polarization process and can take values between 0 (pure resistance Qp) and 1 (pure capacitance Qp).
The average time constant for the polarization process can be defined as Its unit is “s” and allows for a more intuitive physical interpretation. With this substitution, the impedance can be expressed as:
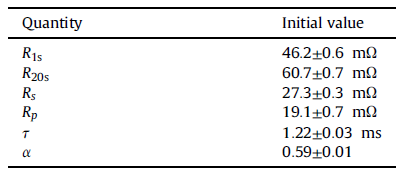
The model contains seven fitting parameters, four of which were analyzed in this research project are Rs, Rp, α and τ. Inductance L, which is partly due to the influence of external connecting cables, has no significant effect on cell performance and aging. It is used as a high frequency parameter for a fitted curve. Impedance spectrum analysis of slow diffusion process is not involved in this work, due to the difficulty brought by the nature of CPE components. As a result of the fitting analysis, a large scattering diffusion parameter Qd and β was noticed. The fitting parameters have no bounds to be set because there is no literature background that defines similar parameters. The only important aspect worth mentioning is the choice to describe the diffusion process with generalized CPE elements, rather than War-burg elements (where β = 0.5) because the semi-infinite diffusion assumption is not valid in our project. β hovered around 0.7 (±0.07) throughout the approximately one-year analysis period.
The new cell is considered to have a smaller SEI resistance, so the semicircle seen in the initial spectrum in Fig. 3(a) should be mainly due to the charge transfer resistance of the two electrodes. Although the spectrum of the aged cell in Figure 3(a) shows an incomplete separation into (at least) two semicircles that are divided into two parts, the spectrum can still be well fitted with the chosen equivalent circuit mode. The fitted parameters obtained in such a case will reflect the total polarization resistance and capacitance.
In order to better fit the EIS impedance spectrum data in chronological order from the beginning to the end of 360 days, a model described by Equation (6) was developed. The Levenberg-Marquardt nonlinear algorithm is used to solve least squares curve fitting. For the first dataset, the parameters are guessed. The parameters obtained from the least squares are the initial parameters for the next impedance data set, respectively. Due to the individual differences of the cells, the generated initial parameters may have some changes.
Therefore, from the beginning of the experiment, the parameters measured from the impedance spectrum for fitting were normalized. As in the pulse test analysis, the average values of three cell parameters with similar aging degrees are given below. In addition, the average values of the parameters extracted from the spectra of the unaged cells are listed in Table 4 for comparison along with the initial internal resistance values determined from the pulse test.
About 360 days of stored EIS data have been analyzed. Note that the one-year time limit is imposed, the parameter deviations obtained from the impedance spectrum fitting of the aged cells are getting larger and larger, and the mathematical model gradually shows ineffectiveness for the impedance spectrum data.
Buy Now: SEMCO Cell Grading Machine – SI ES 5V 3A 512CH – Energy Saving.
3.2.3) Fitting Results
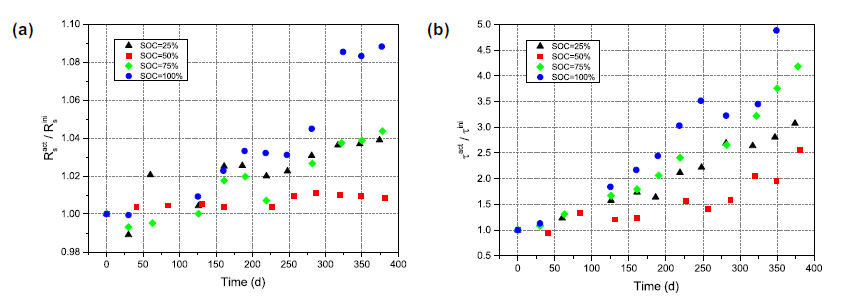
(Fig. 4(a) and (b)) The general trend of the series resistance Rs is to increase with the deepening of the aging process at all temperature and SOC conditions. This is consistent with some previous published research results. Two results can be drawn from Figure 4(a) and (b). A range of cell resistances all increase with increasing temperature, and the Rs of cells stored at 100% SOC increases at a higher rate than 50% SOC. The nature of the increase is fairly regular in all cases. The series resistance Rs is a measure of the ohmic resistance in the battery, and it is theorized that this is mainly due to the conduction hindrance of lithium ions in the electrolyte. Therefore, the reason for the increase in Rs points to the degradation reaction of the electrolyte, which increases faster at higher voltages, i.e., higher SOC, and higher temperatures.
The parallel resistance Rp resistance, representing polarization, shows a general upward trend (Fig. 4(c) and (d)) for all cases except storage at 0 °C, 50% SOC. In the case of high temperature and high storage SOC (45 °C, 50% and 100% SOC; 20 °C, 100% SOC), the upward trend is clear, and it is demonstrated that both temperature and SOC affect this parameter. The relative change of Rp is much higher than that of Rs. However, for other cases, fluctuations were observed in the fitting results. The overall trend in Figure 4(c) and (d) is that at 0 °C, the increase in Rp is not obvious, while the increase in 100% SOC cells is higher than that of 50% SOC cells.
Some people use pulses to calculate the internal resistance of the battery at 30°C and 45°C for 30% SOCVL6P cells at 30°C, some at 25°C and 40°C, and the fluctuations of the results measured at lower temperatures are consistent with this. The project is similar; the high temperature data has better linearity and regularity, which is consistent with the high temperature data in this project. Other studies have tested under high temperature and high SOC storage conditions and can see that the resistance increases linearly with time, in this case, the average increase in Rp is many times the increase in Rs. The initial value of Rp is 0.7 times that of Rs under the test conditions of 45°C and 100% SOC, but after the 360-day storage test, Rp is equal to Rs.


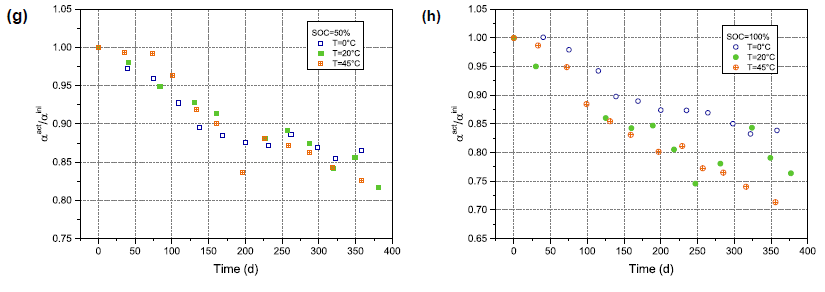
Figure 4. Relative changes in fitted equivalent circuit parameters for calendar aging at 50% and 100% storage SOC and different storage temperatures. (a) and (b): series resistance. (c) and (d): Parallel resistance. (e) and (f): time constants. (g) and (h): inhibitory factors.
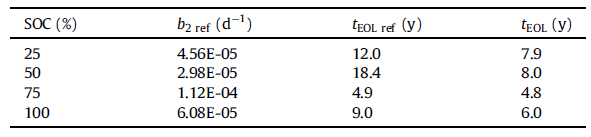
The average time constant t is interpreted as a measure of the dynamic behavior of the battery. Since different surfaces on the electrodes have different electrochemical activation energies, they determine the distribution of time constants. Therefore, the determination of the average time constant needs to give the surface roughness coefficient α. A higher time constant indicates a slower response to the battery’s current pulses. Therefore, with a higher time constant, the voltage change caused by the current pulse is slower. From Figure 4It can be seen in (e) and (f) that the increase in time constant is a strong function of SOC and has a weaker temperature dependence. The nature of the time constant increase is exponential with the storage time. The increase in time constant in previous experiments can also be observed by observing the critical frequency value at the real axis intercept of the Nyquist plots of the old and new cells, the maximum value of the semicircular depression and the start of the diffusion branch.
The inhibition factor α is a measure of the semicircle given by the ZARC element, which is due to the porous microstructure of the electrode, and likewise, it is a characterization of the inhomogeneity of the electrode surface. α decreases with increasing storage time at all temperatures and SOCs (Figure 4(g) and (H)). α is dependent on storage SOC, with a larger drop at 100% SOC than at 50% SOC over a period of storage time. Furthermore, a stronger temperature dependence is shown at 100% SOC than at 50% SOC. The decrease in A indicates a larger indentation of the semicircle, which in turn may represent the inhomogeneity of the electrode surface rise caused by the increase in porosity. Particle fracturing leads to an increase in the porosity of NMC particles, which is more prominent at high voltage (or high SOC), consistent with our results. A decrease in α, pointing to an increase in the active surface area, can also affect the charge transfer resistance by reducing it.
Note that a word here, a decrease in α, stands for an increase in active area, and we should be careful to understand the fact that the SEI and CT semicircles separate with aging, and the CT semicircles move toward lower frequencies. (See Figure 3(a)). In the process of two (or more) separations, where only one ZARC element is connected, an exaggerated reduction in the alpha value will occur.
Buy Now: SEMCO HYNN Cell Testers – ECT 5V 5A 128CH.
3.3 Influence of Electrochemical Parameter Measurement
3.3.1) Reference Cell
Four cells were stored at 20°C for 186 days after initial parameter measurement. Unlike other cells, no parameter measurement is performed in the middle. These cells are called reference cells. Their relative capacity fading and the capacity fading of the cells characterized every 30 days are shown in Figure 1. Reference cells are used to study the effects of conventional qualification procedures for cell degradation. It can be seen that the 186-day capacity decay of the reference cell is smaller than that of the cell stored under the same conditions and measured every 30 days. The capacity loss of the reference cell follows the same SOC dependency as the other cells.
The reference cell and the cell measured on a periodic basis also show differences in the variation of the internal resistance with time, as depicted in Figure 2. After 186 days of storage at 100% SOC of the reference cell, R 1s increased by only about 2%, while the R 1s of conventional cells stored at this SOC increased by about 7% over the same time. Other reference cells even showed a reduction in R 1s after 186 days. The same properties were also observed on R20. The faster aging of conventionally characterized cells can be explained by additional degradation caused by electrochemical parameter measurements that require charging and discharging of the cells. It is widely believed that cycling lithium-ion batteries results in accelerated deterioration compared to calendar aging. Additional mechanical degradation of graphite anodes due to volume changes during charging and discharging can lead to SEI cracking. Subsequent repairs result in additional lithium consumption and therefore capacity loss.
Even though this experiment needs to be repeated with a large number of samples, it is already a strong demonstration that the electrochemical characterization in the calendar aging test has a non-negligible effect on the measured capacity fading and internal resistance changes.
3.3.2) Impact of Differences in Reset SOC
The amount of charge and discharge during cell measurement and SOC reset can be estimated from an equivalent complete charge-discharge cycle (EFC). One EFC corresponds to twice the rated capacity (1EFC = 4.3 Ah). During the test, the cells were stored at 50% SOC and 100% SOC and 20°C for parameter measurement and SOC reset, and the charge-discharge equivalent was equivalent to 60 complete cycles. The cells were stored at 25% SOC and 75% SOC at 20°C for about 100 and 92 equivalent full cycles of charge and discharge, i.e., these cells had 50% more power than cells stored at 50% and 100% SOC. charge and discharge capacity.
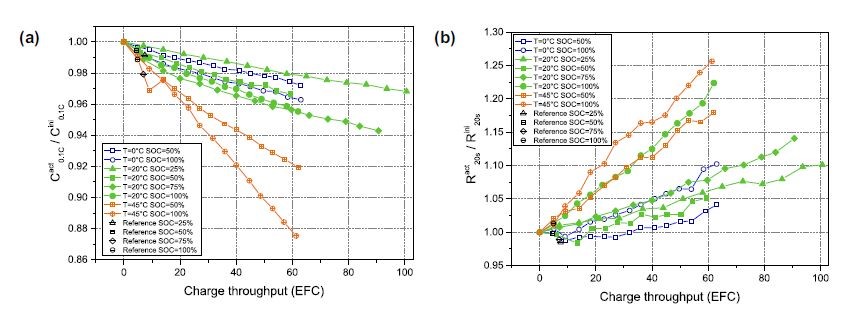
This is due to the procedure of setting different SOC levels after the test used in this study, offering another possibility to analyze the effect of process charging throughput on aging. In Fig. 7(a), the remaining battery capacity is plotted as a function of the charge flux Q instead of time as shown in Fig. 1. As described in Section 3.1, when capacity decay is viewed as a function of time, batteries stored at 25% SOC and 75% SOC show unexpectedly rapid capacity decay compared to batteries stored at 50% SOC and 100% SOC. However, cells stored at 25% SOC showed the slowest rate of capacity fading when capacity fading was considered as a function of charge throughput. This was followed by cells stored at 50% SOC as expected. It can therefore be deduced that the relatively higher rate of capacity fade in batteries stored at 25% SOC compared to batteries stored at 50% SOC is due to the additional cycles these batteries undergo during resetting the SOC.
It can also be understood why the battery stored at 75% SOC, which shows the fastest capacity reduction as a function of time, is shown in Fig. 1(a). When plotted against charge flux, cells stored at 75% SOC showed a similar rate of capacity fading to cells stored at 100% SOC, as shown in Fig. 7(a).
In Fig. 7(b), the change in internal resistance R20s is plotted as a function of charging throughput. Cells stored at 50% SOC still had the slowest rise in resistance, but the difference from cells stored at 25% was much smaller than when time was used as an independent variable.
3.3.3) Effects Revealed by EIS Analysis
Additional evidence affecting calendar ageing comes from the EIS analysis. In Fig. 4, compared with the case of 50% SOC at 100% SOC, Rs, Rp and τ are obviously increased while the time constant is obviously decreased. This is expected as higher SOC or higher voltage is known to intensify battery aging.
However, looking at the parameters Rs and τ for 25% SOC~75% SOC cells stored at 20°C, as shown in Figure 8, it can be clearly seen that 50% SOC cells have the smallest Rs and τ.
Taking this anomaly into account according to the measurement procedure used, it is apparent that the additional degradation that occurs at 25% SOC is due to the measurement process. Batteries stored at 25% SOC and 75% SOC experienced more charge throughput than batteries stored at 50% SOC and 100% SOC. The additional aging due to increased measurements at 75% SOC may be masked by a larger increase in calendar aging of 100% SOC cells. In fact, 25%, 75% and 100% SOC are as expected for all four parameters if the data from 50% SOC is ignored.
Buy Now: SEMCO HYNN Cell Testers – Dect 5V 100A 24CH.
3.3.4) Results of Life Prediction
As mentioned earlier, expected battery life under given operating conditions is the primary goal of aging studies. It is generally considered that a battery has reached its end of life (EOL) when its actual capacity has dropped to 80% of its initial value. The expected calendar life t EOL based on the linear aging model (Eq. (2)) parameterized in Section 3.1 is listed in Table 5
The effect of calendar aging on cyclic aging testing has been discussed in the literature. In contrast, the effects of electrochemical parameter measurements on calendar aging tests have been largely ignored so far. The parameterization of the linear aging model (Equation (2)) can be based on the experimental data obtained from the capacity decay of the reference cell, which is set up to analyze the influence of the electrochemical parameter test. Based on a linear aging model, life prediction can be made using its data. The resulting aging factor b2ref and the corresponding life expectancy tEOLref are listed in Table 5.
For all storage conditions except 75% SOC, the expected cycle life is at least 50% longer when the reference cell is used in the parametric aging model. Common procedure for alternating storage and measurement of lithium-ion battery parameters, Overestimation of calendar aging may thus result, since the measured capacity reduction is not only due to calendar aging, but also includes cyclic aging brought about by parametric measurements.
The linearity of capacity decay with storage time observed in this study may also be due to normal parameter measurements, since capacity decay during cyclic aging has been studied, at least in the early stages of battery life is linear with charging throughput.
Conclusion
It has been observed that the results of the calendar aging study are significantly affected by the SOC setting method, a phenomenon that has been overlooked in many studies conducting similar calendar life of lithium batteries. It is conceivable that the real calendar life of lithium batteries is longer than the usual experimental results. How much impact the SOC setting process has, the quantitative assessment needs to design special experiments for further research.
More Articles:
Function and Components of Battery Pack & BMS,
Cell BMS Pack Failure Analysis,
Key Points of Lithium-Ion Battery Production Process Control,
Lithium-ion Battery Packaging Information for Beginners,
Lithium Battery Protection Board,
Basic Knowledge of Lithium-ion Battery Commercialization,
Action protector in electric vehicle charging system,
Production problems of lithium batteries,
Formation Process of Lithium Battery,
How the Three Electrode System Works,
Electric Vehicle Maintenance Practical Dry Goods,